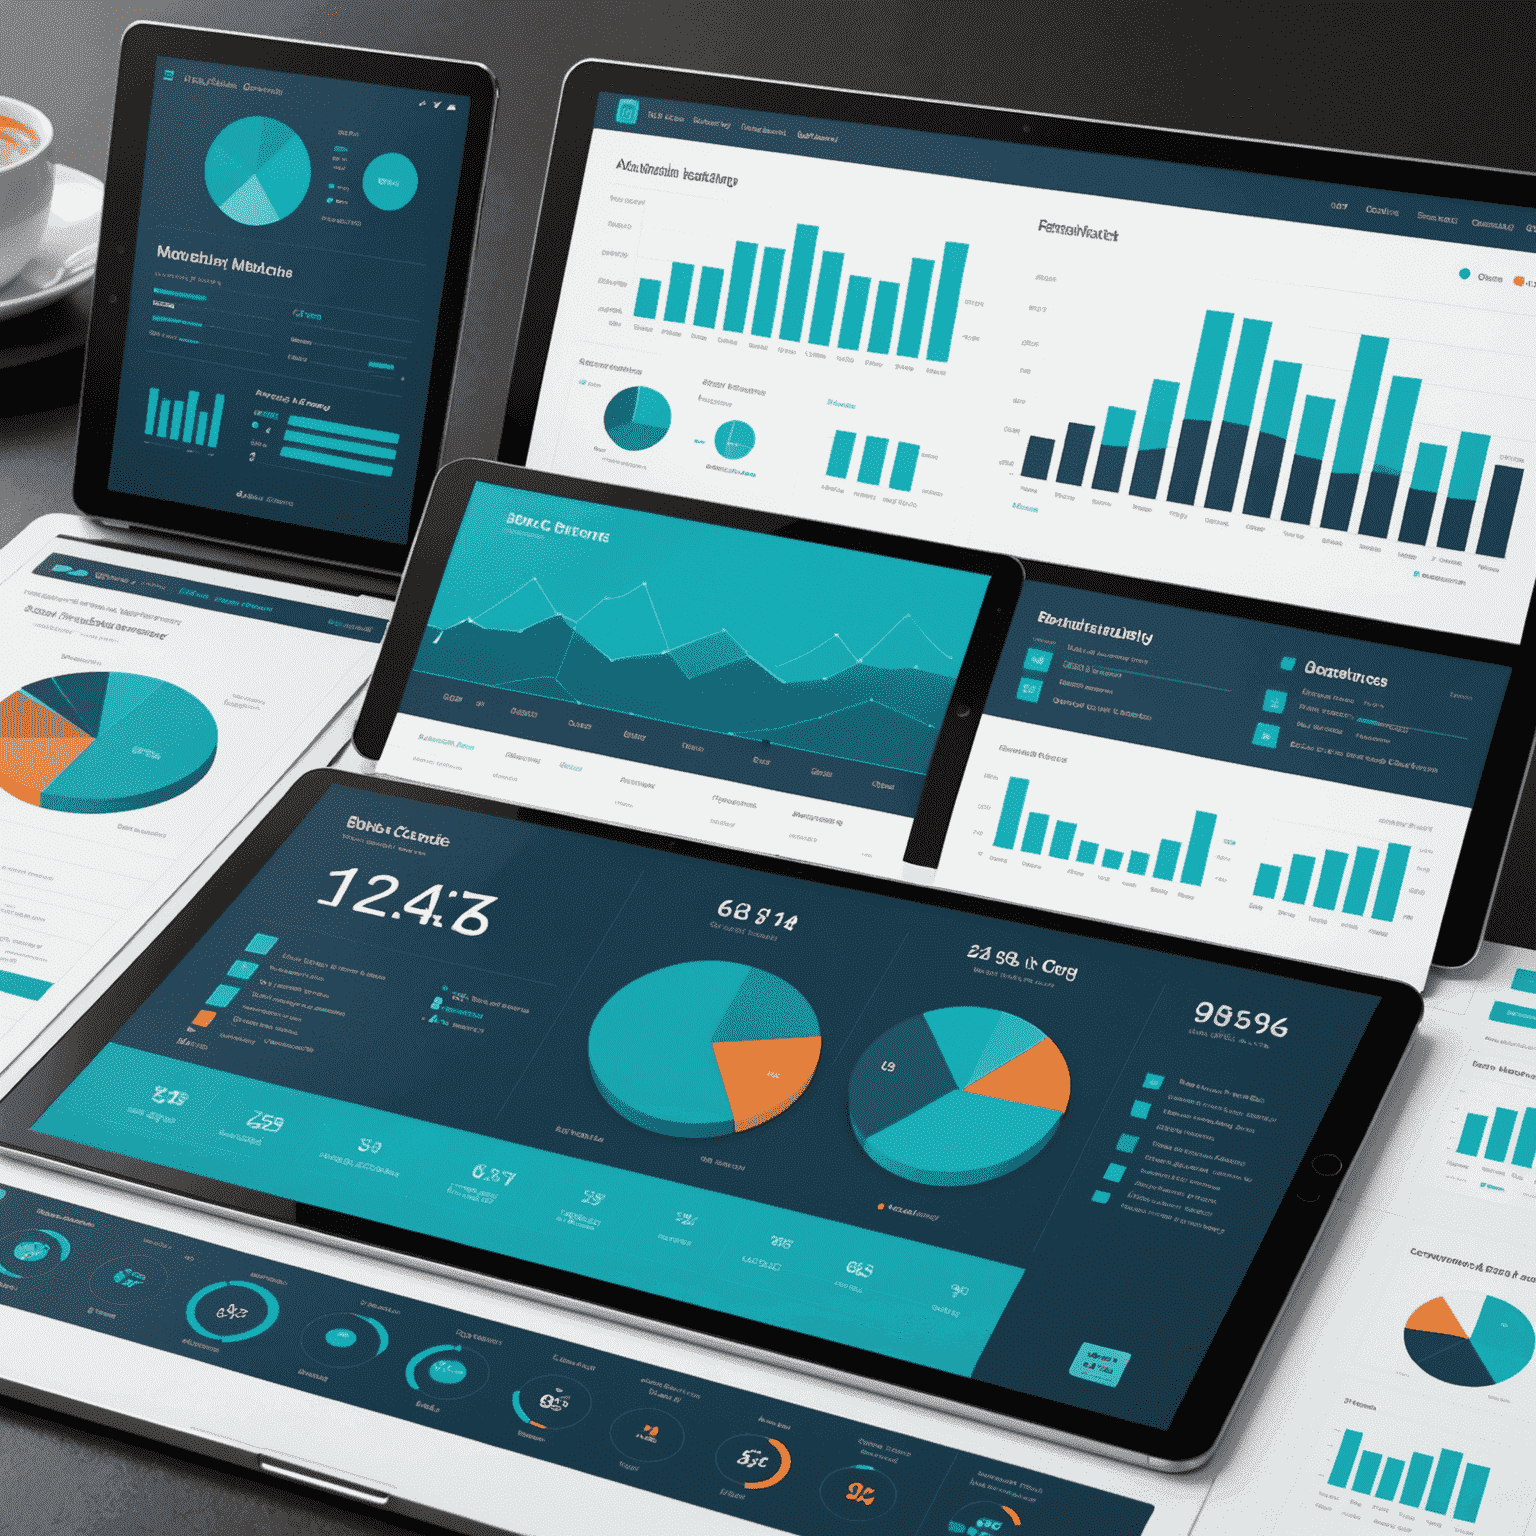
Data Visualization Services
Transform complex data into clear, actionable insights with our cutting-edge data visualization services. We specialize in creating interactive charts, graphs, and infographics that empower your business decision-making process.
Why Choose Our Data Visualization Services?
- Advanced Business Analytics Reporting
- Enhanced Data Comprehension
- Data-Driven Decision Making
- Interactive Dashboards
- AI-Driven Insights
Our Data Visualization Process
1. Data Analysis
We begin by thoroughly analyzing your business data, identifying key metrics and trends that are crucial for your decision-making process.
2. Design & Development
Our expert team designs and develops custom visualizations tailored to your specific needs, ensuring clarity and impact in data presentation.
3. Implementation & Training
We implement the visualizations into your existing systems and provide comprehensive training to ensure your team can leverage these insights effectively.
Featured Visualization Techniques
Interactive Dashboards
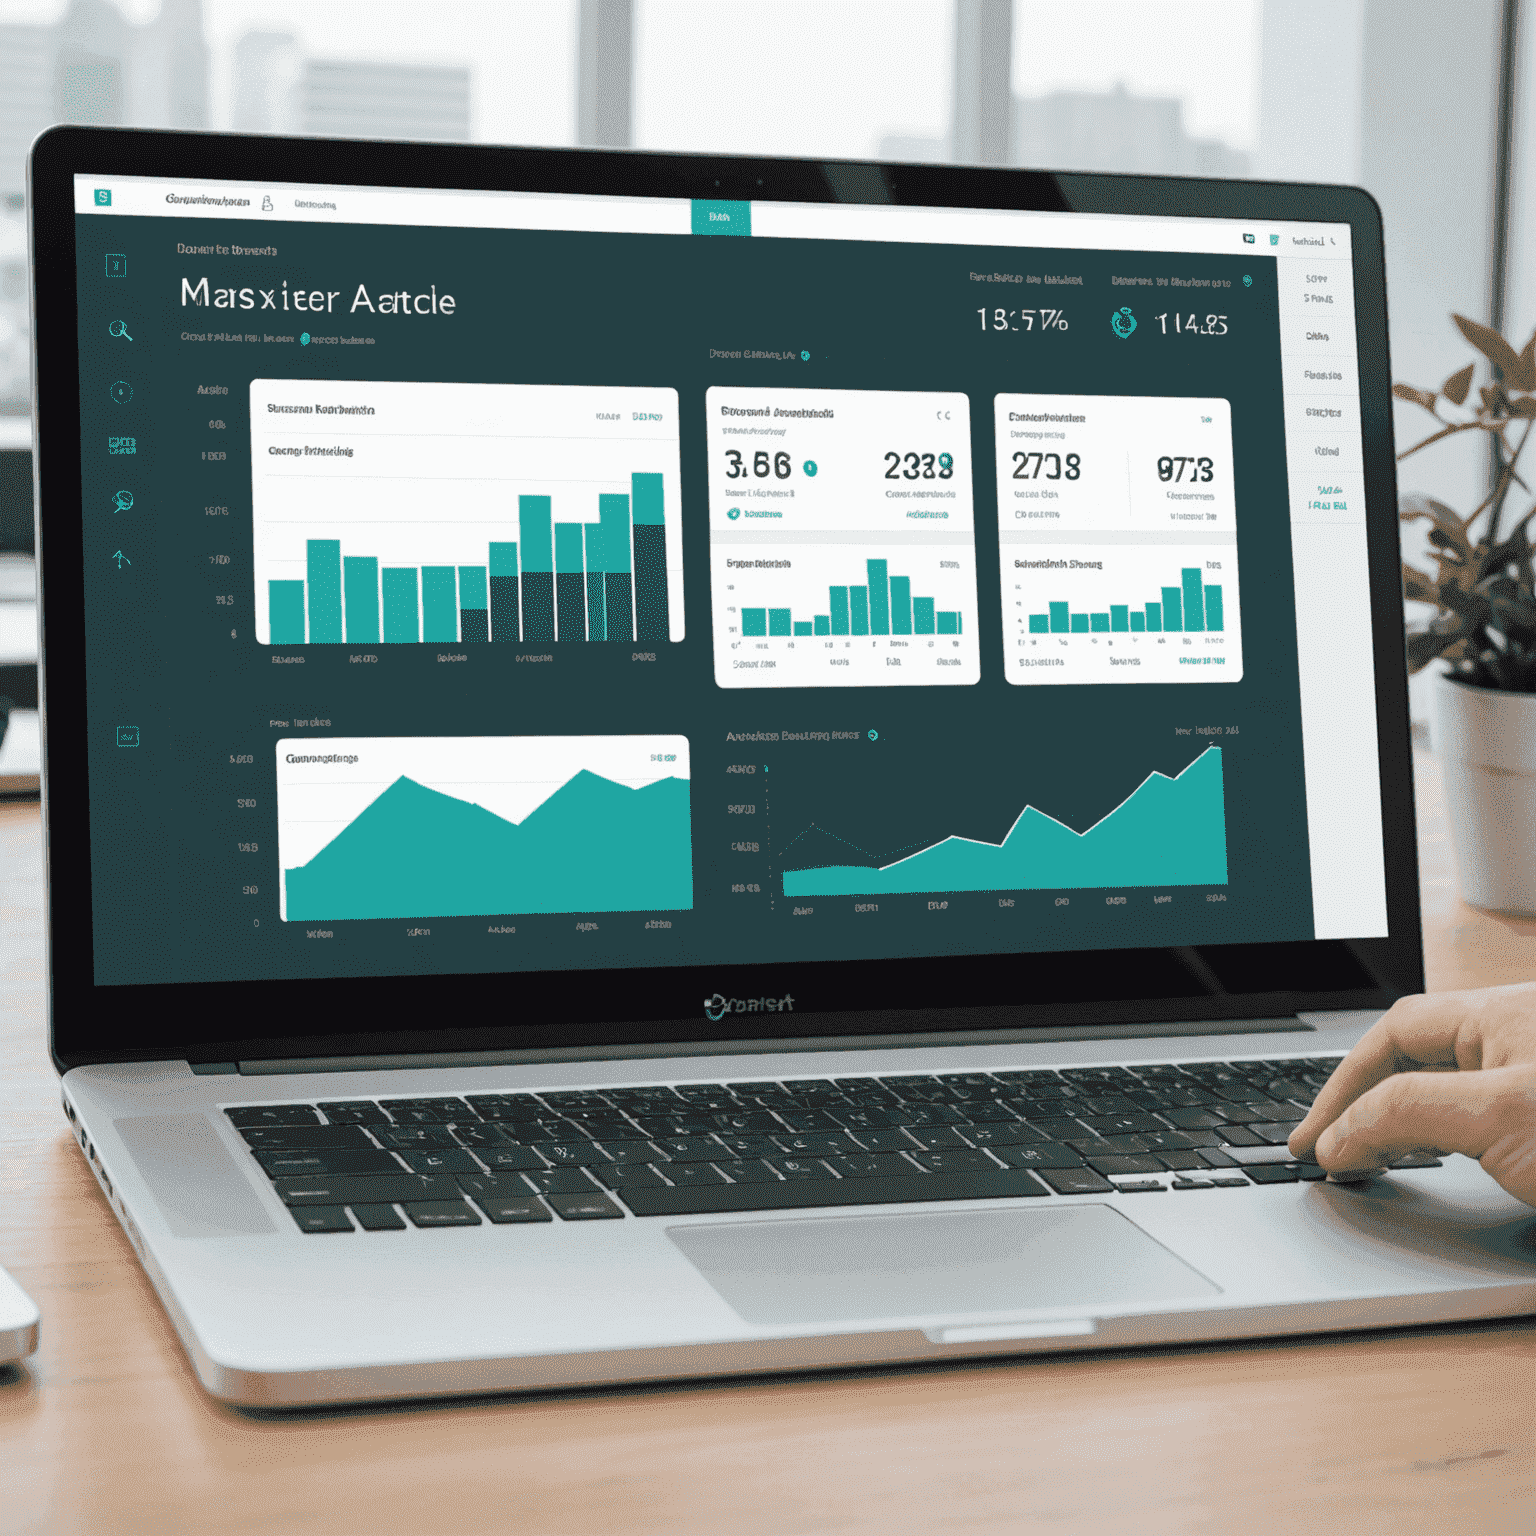
Customizable dashboards that provide real-time insights into your key business metrics, allowing for quick and informed decision-making.
Predictive Analytics Visualizations

Advanced visualizations that leverage AI and machine learning to forecast trends and help you stay ahead of market changes.
Transform Your Data into Actionable Insights
Our data visualization consulting services are designed to help you unlock the full potential of your business data. By transforming complex information into clear, visually appealing, and interactive formats, we empower your team to make data-driven decisions with confidence. Whether you need advanced business analytics reporting, predictive analytics consulting, or comprehensive data management solutions, our expert team is here to guide you through every step of the process.